The net emission coefficient is the simplest approximation to radiative energy transport. It is derived based on the P1 approximation where it is assumed that radiation transport can be approximated with a diffusion equation. The final result is that the radiative thermal conductivity can be expressed as \begin{equation} \lambda_R = \int \frac{4\pi}{3\kappa_{\nu}} \frac{\mathrm{d}B_{\nu\Omega}}{\mathrm{d}T} \mathrm{d}\nu, \end{equation} where \(\kappa_{\nu}\) is the absorption coefficient, \(B_{\nu\Omega}\) the thermal radiation, \(T\) the temperature, \(\nu\) the frequency and \(\Omega\) the solid angle. In this calculation only contributions \(\kappa \gt \kappa_{min}\) are taken into account since the approximation otherwise is not valid. It is also possible to express the same process as an energy source term using [1] \begin{equation} S_R = \int B_{\nu\Omega} \kappa_{\nu} \exp\left( - \kappa_{\nu} R\right)\mathrm{d}\nu, \end{equation} with \(R\) corresponding to the radius of an isothermal sphere.
Results from PLASIMO's net emission coefficient calculator are compared to results from Naghizadeh et al. [2] for \(R=0\) and for \(R=10\) cm for three mixtures: O2, N2 and air.
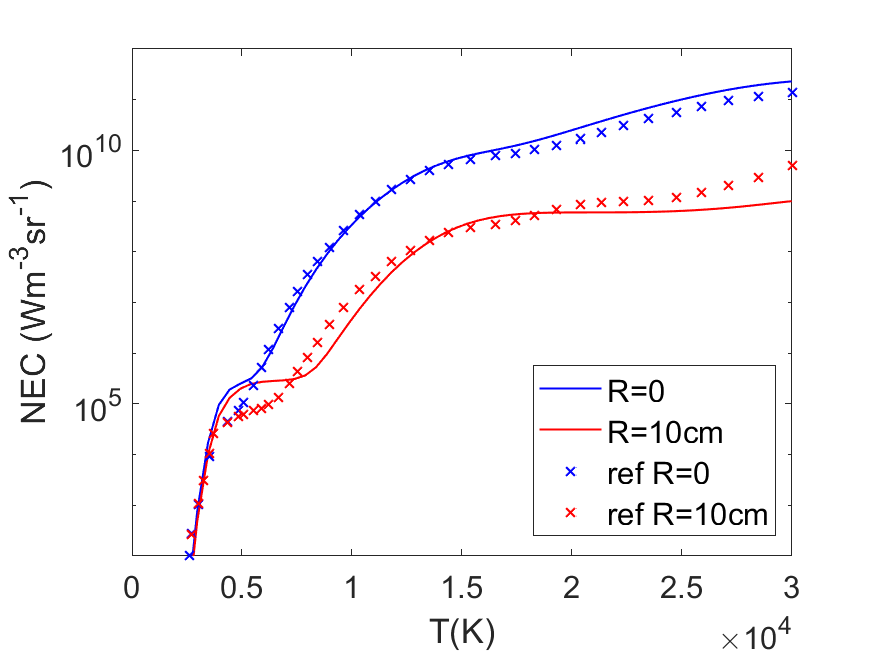
Oxygen
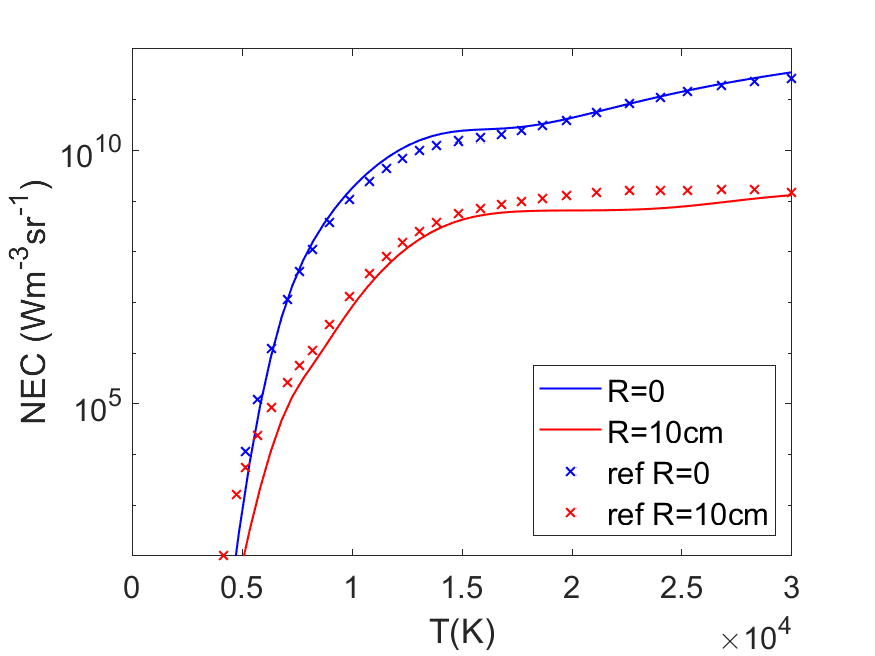
Nitrogen
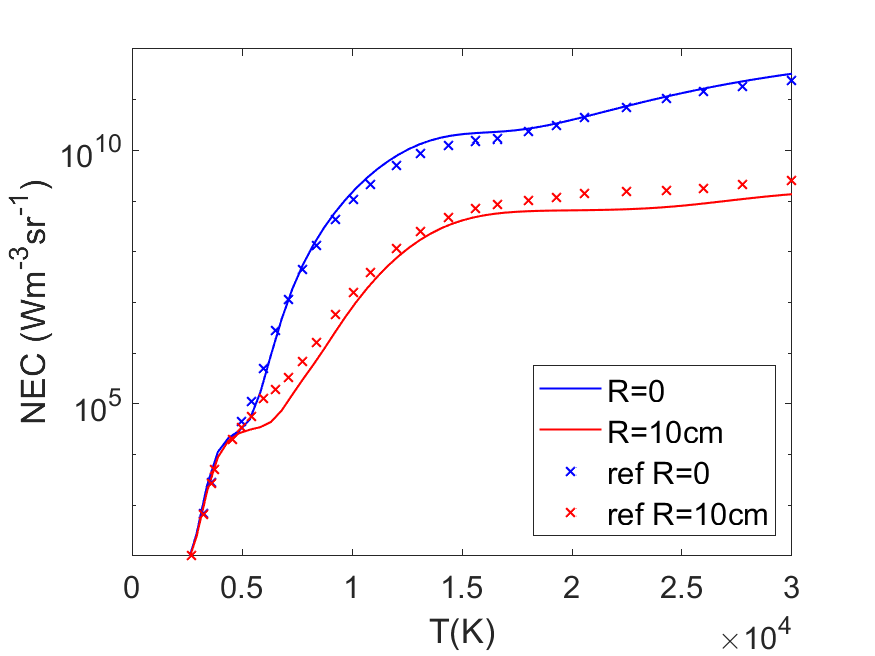
Air
For O2 there is a good agreement with the results at \(R=0\) cm. For temperatures above 5000 K the dominant contribution is atomic radiation. There are small differences between the calculated values. This is related to the different sets of spectral lines that are being used. PLASIMO uses spectral lines from NIST while Naghizadeh uses a combination of the NIST and the Kurucz [3] databases from 2002. For temperatures below 4000 K the agreement is also very good. Between 4000 K and 5000 K the plateau for the NEC value is higher in PLASIMO in comparison to Naghizadeh. This originates from the usage of different spectroscopic data for the vibrational and rotational states. The result for \(R=10\) cm shows similar features as the \(R=0\) cm result. The differences are slightly increased and that is caused by the calculation procedure of Naghizadeh [2, p. 2932] where they state that only 1614 of the atomic spectral lines out of the total 15530 have an escape factor smaller than 1. In PLASIMO all included transitions have an escape factor that is calculated by the software. This difference is responsible for the lower values in PLASIMO in most of the atomic continuum.
For N2 and air the agreement with Naghizadeh et al. is very good for the \(R=0\) curve. The atomic continuum matches very well. At lower temperatures the molecular contribution is a bit lower for N2 due to the usage of different spectroscopic constants. The differences in the \(R=10\) cm curve are more pronounced again. Mostly, in the low temperature part where Naghizadeh neglects the absorption from the molecules. At higher temperatures it is also clear that Naghizadeh does not include every transition in the calculation of the absorption.
References
[1] J.J. Lowke. Predictions of arc temperature profiles using approximate emission coefficients for radiation losses. Journal of Quantitative Spectroscopy and Radiative Transfer, 14(2), 111 -- 122, 1974.
[2] Y Naghizadeh-Kashani, Y Cressault, and A Gleizes. Net emission coefficient of air thermal plasmas. Journal of Physics D: Applied Physics, 35(22), 2925–2934, nov 2002.
[3] R.L. Kurucz and B. Bell. Atomic line data. Kurucz CD-ROM No. 23. Cambridge, Mass.: Smithsonian Astrophysical Observatory, 1995.